CCPI > Products > BEQ EMOTIONAL INDEXES

BEQ EMOTIONAL INDEXES

BeQ Emotional Indexes : A Deep Dive into Market Psychology

In the ever-evolving world of finance, where algorithms and analytics dominate headlines, BeQ Holdings is taking a bold step toward humanizing market analysis. Their latest innovation—the BeQ Emotional Indexes, specifically the Fear & Greed Index—offers a compelling lens into the emotional undercurrents that drive investor behavior and market volatility.

The Psychology Behind the Numbers

Markets are not just moved by earnings reports or interest rate decisions—they are swayed by emotion. Fear and greed, the two primal forces of financial decision-making, often override logic and fundamentals. The BeQ Fear & Greed Index quantifies these emotions on a 0–100 scale, where:

  • 0–25 signals Extreme Fear
  • 26–45 indicates Fear
  • 46–55 reflects Neutral sentiment
  • 56–74 suggests Greed
  • 75–100 warns of Extreme Greed

This scale is more than a mood ring for the market—it’s a strategic tool for investors, analysts, and educators alike.

How It Works: The Seven Pillars of Sentiment

The BeQ Index is built on seven equally weighted indicators, each capturing a unique facet of market behavior:

  1. Market Momentum: Tracks the S&P 500’s performance against its 125-day average. Rising momentum signals greed; falling momentum reflects fear.
  2. Stock Price Strength: Measures the number of stocks hitting 52-week highs versus lows. More highs = optimism; more lows = pessimism.
  3. Stock Price Breadth: Evaluates volume trends using the McClellan Volume Summation Index. Strong volume on up days suggests greed.
  4. Put/Call Options Ratio: A higher ratio of puts (bets against the market) indicates fear; more calls (bullish bets) show confidence.
  5. Market Volatility (VIX): Known as the “Fear Gauge,” the VIX reflects expected volatility. High VIX = fear; low VIX = calm.
  6. Safe Haven Demand: Compares returns on stocks vs. Treasuries. A flight to bonds signals fear; preference for stocks shows greed.
  7. Junk Bond Demand: Assesses appetite for high-risk bonds. Narrow spreads suggest greed; wide spreads indicate caution.

Implications

The BeQ Emotional Indexes are not just academic exercises—they are actionable tools. Here’s how they’re being used:

  • Investment Timing: Extreme fear often precedes market rebounds; extreme greed may signal bubbles.
  • Risk Management: Helps investors adjust exposure based on emotional climate.
  • Behavioral Finance Education: Integrated into BeQ’s Virtual Trading Platform (VTP) to teach students how emotions affect markets.
  • Portfolio Strategy: Guides diversification decisions—e.g., shifting to bonds during greedy phases.

Presentation & Accessibility

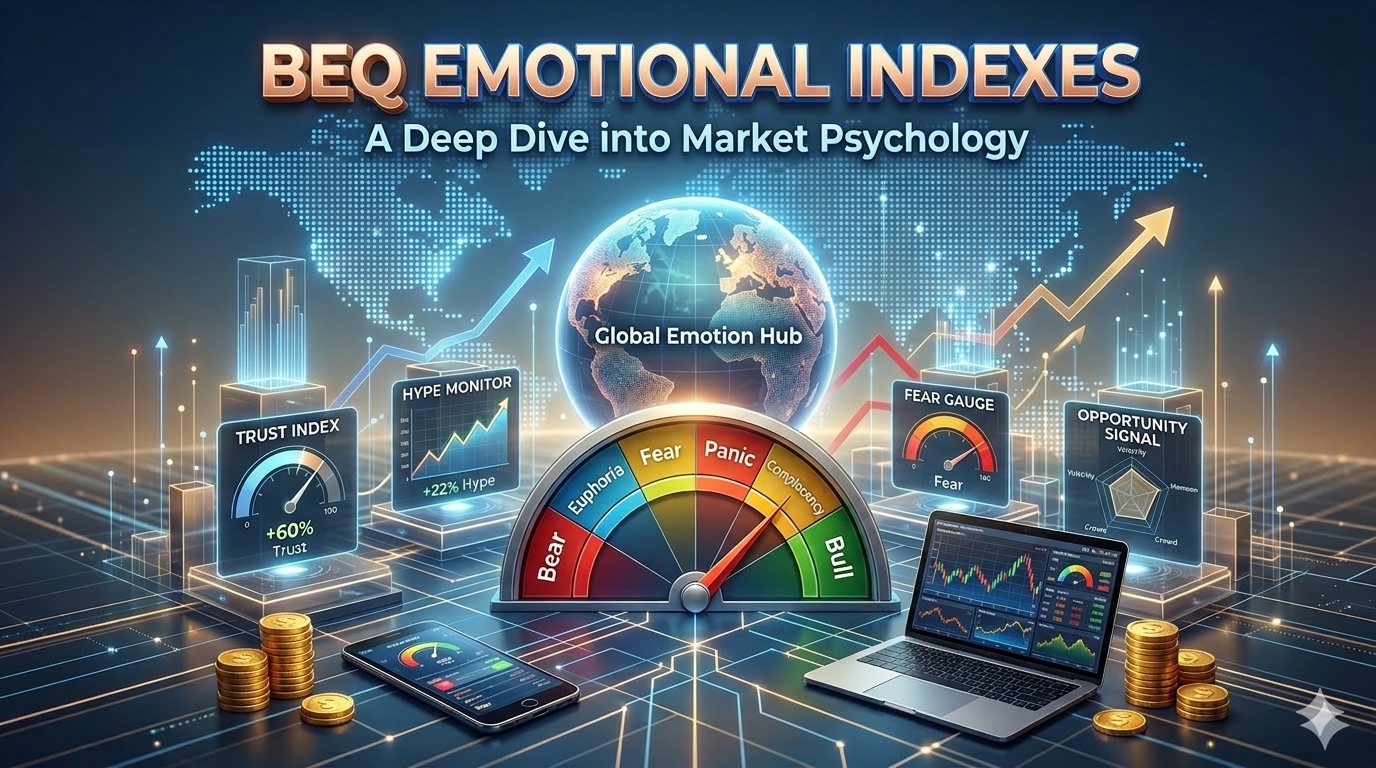
BeQ presents its Emotional Indexes through:

  • Real-time dashboards with gauge-style visuals
  • Historical sentiment charts for trend analysis
  • Heatmaps across sectors and regions
  • Alerts for sentiment extremes

These tools are embedded in BeQ’s Cloud Computing Platforms—CCPR for research and CCPI for investing—ensuring scalability and integration with data science workflows.

A New Era of Sentiment-Aware Investing

In a financial landscape increasingly shaped by AI and automation, BeQ’s Fear & Greed Index reminds us that emotion still rules the markets. By quantifying sentiment, BeQ empowers investors to navigate volatility with clarity—and perhaps, with a little less fear.

BeQ Global Indexes design, calculate, and maintain about 6,000 Emotional indexes covering different types and major financial instruments (stock, indexes, funds, commodities, FOREX currencies, cryptos, …) and different maturities.

Share This