
Vietnam’s real estate market has always been a barometer of national ambition—an arena where urban growth, industrialization, and foreign investment collide. Today, as Vietnam accelerates toward emerging‑market maturity, the BeQ Vietnam VNX Real Estate Indexes have become one of the most important tools for understanding and navigating this rapidly evolving sector.
With extraordinary performance and globally aligned methodology, these indexes position BeQ as a key architect of Vietnam’s financial modernization.
The real estate sector sits at the heart of Vietnam’s development story. Explosive urbanization, rising middle‑class demand, industrial‑park expansion, and infrastructure mega‑projects have created a market that moves faster than traditional economic indicators can track.
The BeQ Vietnam VNX Real Estate Index was built to answer a structural need: a transparent, rules‑driven, internationally credible benchmark that translates this sector’s momentum into hard data.
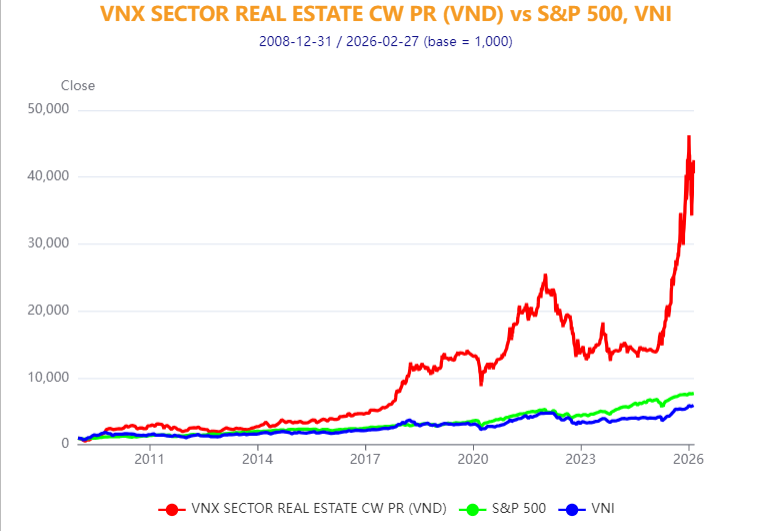
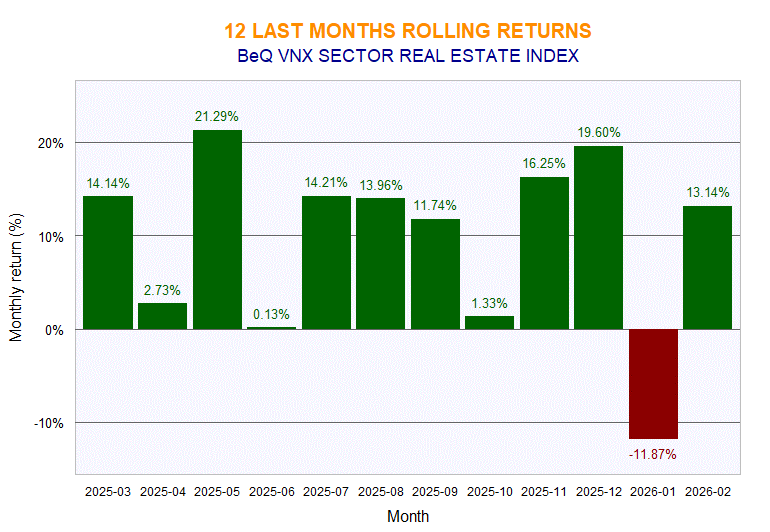
Its latest update shows a staggering 203% 12‑month rolling performance, far eclipsing both the VNI (44.53%) and the S&P 500 (17.28%) over the same period. This outperformance signals a sector undergoing rapid transformation—and a benchmark designed to capture it with precision.
Real estate in Vietnam is more than housing—it is a convergence of logistics, manufacturing relocation, industrial infrastructure, consumer expansion, and urban policy. These forces create volatility, opportunity, and dispersion among listed property developers.
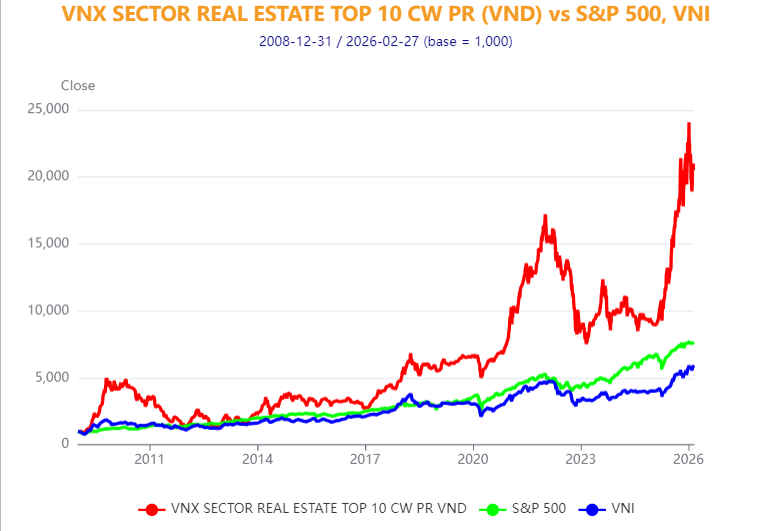
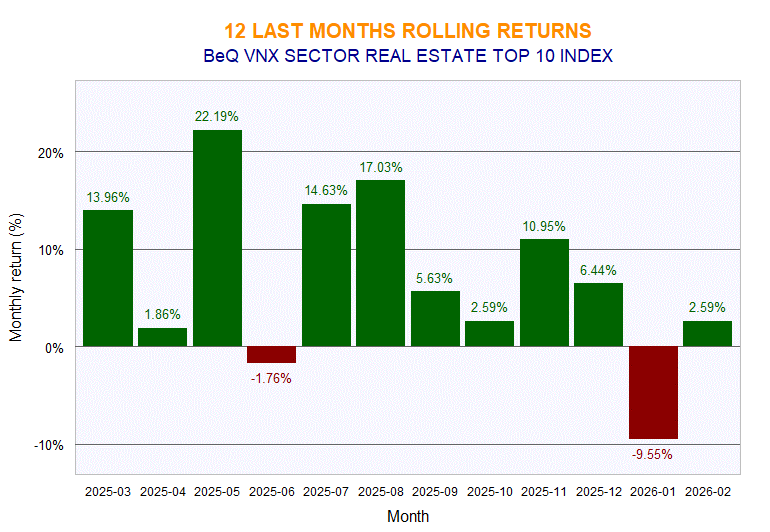
The VNX Real Estate Index measures the full breadth of the sector, while its concentrated counterpart—the BeQ Vietnam VNX Real Estate Top 10 Index—provides a sharper focus on its most liquid, influential, and strategically positioned companies. The Top 10 Index delivered 124% over the past 12 months, reinforcing its role as an actionable proxy for institutional allocations.
Together, the two indexes offer a dual‑layered understanding of sector behavior: broad‑based insights + tactical, high‑momentum exposure.
Vietnam’s rapid ascent demands more sophisticated analytical and investment tools. Traditional sector reporting often lags months behind market events, while foreign investors require transparent benchmarks aligned with global standards.
The BeQ Real Estate Indexes respond to this need by offering:
In short, they convert a complex, narrative‑driven sector into a dataset investor can trust.
The index is designed in accordance with international standards and is UCITS-compliant, making it suitable for supporting funds, ETFs, derivatives, and structured products.
BeQ Vietnam VNX Real Estate Index cover all eligible Vietnam Stocks following the BeQ index rule. The index is weighted by the full market capitalization, starting at 1,000 on the base date on December 31, 2008.
BeQ Vietnam VNX Real Estate Top 10 Index select the ‘best’ top 10 constituents of the BeQ Vietnam VNX Real Estate Index in term of liquidity, and adjusted capitalization on free float. The index is weighted by the free float market capitalization, starting at 1,000 on the base date on December 31, 2008.
The Primary BeQ Vietnam VNX Real Esate Indexes are calculated in Price Return (PR) format, with Total Return (TR) and Net Return (NR) versions also available. The standard index currency is VND, while additional currency versions—such as AUD, CAD, CNY, EUR, GBP, HKD, JPY, KRW, SGD, USD, and USDC—are provided for overseas investors to reflect their actual performance.
Last Updated: February 27, 2026
Last Updated: February 27, 2026
Last Updated: February 27, 2026
Last Updated: February 27, 2026