The 21st century has been marked by an unprecedented surge in uncertainty. From geopolitical tensions to climate change, economic volatility to technological disruption, the world seems to be in a constant state of flux. This increasing uncertainty has far-reaching implications for individuals, businesses, and societies as a whole.
One of the primary drivers of this trend is the rapid pace of technological advancement. While innovation has brought numerous benefits, it has also created new challenges. The constant emergence of new technologies can disrupt industries, render existing skills obsolete, and create job insecurity. Additionally, the increasing reliance on digital infrastructure has made societies vulnerable to cyberattacks and data breaches, further exacerbating uncertainty.
Geopolitical tensions and conflicts also contribute to the rise of uncertainty. Trade wars, geopolitical rivalries, and the proliferation of non-state actors have created a complex and unpredictable global landscape. These factors can lead to economic instability, supply chain disruptions, and increased geopolitical risk.
Climate change poses another significant source of uncertainty. The impacts of climate change, such as extreme weather events, rising sea levels, and biodiversity loss, have the potential to disrupt economies, displace populations, and trigger social unrest. As the effects of climate change intensify, the future becomes increasingly uncertain.
In response to this growing uncertainty, individuals, businesses, and governments must adopt a more adaptive and resilient approach. This may involve diversifying investments, building robust supply chains, and investing in education and training to develop a flexible workforce. Additionally, fostering international cooperation and multilateralism can help address global challenges and mitigate the risks associated with uncertainty.
Traditional economic and financial models fail to account for psychological factors, leading to inaccurate analysis and predictions of market behavior.
Behavioral finance bridges the gap between psychology and economics, revealing how human emotions and cognitive biases significantly influence financial decision-making. It challenges the traditional assumption of rational economic behavior, offering valuable insights into the often irrational choices people make with their money.
By understanding cognitive biases like overconfidence, loss aversion, and herd mentality, investors can make more informed decisions. Behavioral finance empowers individuals to recognize these biases and develop strategies to mitigate their impact, leading to improved long-term financial performance.
Moreover, behavioral finance has practical applications for financial advisors and policymakers. Advisors can tailor their advice to clients’ specific psychological profiles, while policymakers can design regulations that address irrational behavior and promote financial literacy.
Behavioral finance provides a comprehensive framework for understanding the psychological factors that drive financial decisions. By recognizing and addressing these biases, individuals, investors, and policymakers can make more rational choices and achieve greater financial success.
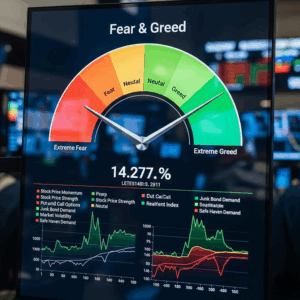
The Fear & Greed Index is a tool used to gauge stock market movements and assess whether stocks are fairly priced. This concept is based on the idea that excessive fear tends to drive stock prices down, while excessive greed tends to push them up.
The Fear & Greed Index compiles seven different indicators that measure specific aspects of stock market behavior. These include market momentum, stock price strength, stock price breadth, put and call options, junk bond demand, market volatility, and safe haven demand. The index monitors how much these indicators deviate from their averages compared to their usual divergence. Each indicator is given equal weighting to calculate a score ranging from 0 to 100, where 100 represents extreme greed and 0 signals extreme fear.
Many investors are driven by emotions and reactions, and sentiment indicators like Fear & Greed can alert investors to their own emotional biases that may influence their decisions. When combined with fundamentals and other analytical tools, the Index can be a valuable resource for assessing market sentiment.
The Fear and Greed Index is a crucial tool for investors to gauge market sentiment by measuring levels of fear and greed. This index provides an overview of investor emotions, allowing for predictions about market trends and adjustments to investment strategies. When the index shows extreme greed, it may signal an impending price correction, while extreme fear could present a buying opportunity with the expectation of a market rebound. Additionally, the Fear and Greed Index helps identify risks and assess the true value of assets, thereby supporting informed investment decisions and effective risk management.
The Fear and Greed Index operates by analyzing various factors that collectively represent the emotional state of the market. These factors are each assigned a weight and combined to produce a single score, typically ranging from 0 to 100. A lower score indicates a market driven by fear, while a higher score signals a market dominated by greed.
Source: CNN Business
Market Momentum |
Monitor the overall trend of the market indices. An uptrend indicates investor confidence (greed), while a downtrend indicates caution (fear). Momentum reflects the strength of price movements and can signal whether the market is overbought or oversold. This component evaluates the performance of the S&P 500 Index over the past 125 trading days. Based on the index’s movement, it assesses whether the market is in a bullish or bearish trend. |
Stock Price Strength |
Measures the proportion of stocks hitting new 52-week highs versus those hitting lows. A greater number of stocks at new highs indicates widespread market optimism, while more lows suggest pervasive pessimism. |
Stock Price Breadth |
Measures the proportion of stocks hitting new 52-week highs versus those hitting lows. A greater number of stocks at new highs indicates widespread market optimism, while more lows suggest pervasive pessimism. |
Put and Call Options |
Analyzes the ratio of put options (bets that prices will fall) to call options (bets that prices will rise). A higher ratio of puts indicates fear as investors seek protection, while a higher ratio of calls shows optimism and confidence. |
Market Volatility |
The CBOE Volatility Index, known as the VIX or “Fear Gauge,” measures market volatility and is included in the calculation. Market Volatility measures the expected volatility in the stock market. Higher market volatility values indicate increased uncertainty and fear in the market, while lower values indicate calmness and confidence among investors. |
Safe Haven Demand |
Compares the returns of stocks to those of safe-haven assets like Treasuries. A preference for safe havens indicates fear, as investors seek security in more stable investments. Conversely, a preference for stocks suggests confidence and a willingness to take risks. |
Junk Bond Demand |
Junk Bond Demand: This indicator measures investor appetite for high-risk, high-yield, junk bonds. Junk bonds typically offer higher interest rates to compensate for their higher risk of default compared to safer, investment-grade bonds. The spread is the difference in yield between these junk bonds and safer bonds. This index reflects the market’s risk tolerance, and significant changes in this spread can signal shifts in overall market sentiment. |
The Fear and Greed Index is more than just a number; it reflects market sentiment and provides valuable insights into investor emotions. Here are the different levels of the index and their meanings:
Extreme Fear (0-25) |
|
Fearful (26-45) |
|
Neutral (46-55) |
|
Greedy (56-74) |
|
Extreme Greed (75-100) |
|
The Fear and Greed Index isn’t just a number; it’s a tool you can use to make better investment decisions. Here’s how:
Use the index to quickly gauge the overall sentiment of the market. Are investors overly optimistic or pessimistic? This can help you decide whether to enter or exit the market.
Timing Your Investments
When the index is in the Extreme Greed zone, it might be a sign that stocks are overbought, and a market correction could be on the horizon. Conversely, when the index is in Extreme Fear, it might indicate that stocks are undervalued, presenting buying opportunities.
The Fear and Greed Index can help you manage risk by signaling when the market is too euphoric (and thus likely to correct) or too fearful (and potentially undervalued).
Diversification Decisions
If the index shows high levels of greed, you might consider diversifying into safer assets like bonds. If it shows high fear, you might focus on sectors that are traditionally seen as safe havens.
Most people want to get rich as quickly as possible, and bull markets invite us to try it. The internet boom of the late 1990s is a perfect example. At the time, it seemed all an adviser had to do was pitch any investment with “dotcom” at the end of it, and investors leaped at the opportunity. Accumulation of internet-related stocks, many of them barely startups, reached a fever pitch. Investors got exceedingly greedy, fueling ever more buying and bidding prices up to excessive levels. Like many other asset bubbles in history, it eventually burst, depressing stock prices from 2000 to 2002.
As fictional investor Gordon Gekko famously said in the movie Wall Street, “greed is good.” However, this get-rich-quick thinking makes it hard to maintain a disciplined, long-term investment plan, especially amid what Federal Reserve Chair Alan Greenspan famously called “irrational exuberance.”1
It’s times like these when it’s crucial to maintain an even keel and stick to the fundamentals of investing, such as maintaining a long-term horizon, dollar-cost averaging, and ignoring the herd, whether the herd is buying or selling.
An exemplar of clear-eyed, long-term investing is Warren Buffett, who largely ignored the dotcom bubble and had the last laugh on those who called him mistaken. Buffett stuck with his time-tested approach, known as value investing. This involves buying companies the market appears to have underpriced, which necessarily means ignoring speculative fads.
Just as the market can become overwhelmed with greed, it can also succumb to fear. When stocks suffer large losses for a sustained period, investors can collectively become fearful of further losses, so they start to sell. This, of course, has the self-fulfilling effect of ensuring that prices fall further. Economists have a name for what happens when investors buy or sell just because everyone else is doing it: herd behavior.
Just as greed dominates the market during a boom, fear prevails following its bust. To stem losses, investors quickly sell stocks and buy safer assets, like money-market securities, stable-value funds, and principal-protected funds—all low-risk but low-return securities.
This mass exodus from stocks shows a complete disregard for long-term investing based on fundamentals. Granted, losing a large portion of your equity portfolio is a tough pill to swallow, but you only compound the damage by missing out on the inevitable recovery. In the long run, low-risk investments saddle investors with an opportunity cost of forfeited earnings and compounded growth that eventually dwarf the losses incurred in the market downturn.
Just as scrapping your investment plan for the latest get-rich-quick fad can tear a large hole in your portfolio, so too can fleeing the market along with the rest of the herd, which usually exits the market at exactly the wrong time. When the herd is fleeing, you should be buying, unless you’re already fully invested. In that case, just hold on tight.
The advent of 24-7 news and information networks can create strong investor reactions, known as the CNN effect. All this talk of fear and greed relates to the volatility inherent in the stock market. When investors find themselves outside of their comfort zones due to losses or market instability, they become vulnerable to these emotions, often resulting in very costly mistakes.
Avoid getting swept up in the dominant market sentiment of the day, which can be driven by irrational fear or greed, and stick to the fundamentals. Choose a suitable asset allocation. If you are extremely risk-averse, you are likely to be more susceptible to fear, therefore your exposure to equities should be smaller than that of people with a high tolerance for risk.
Buffett once said: “Unless you can watch your stock holding decline by 50% without becoming panic-stricken, you should not be in the stock market.”2
This isn’t as easy as it sounds. There’s a fine line between controlling your emotions and being just plain stubborn. Remember also to re-evaluate your strategy from time to time. Be flexible—to a point—and remain rational when making decisions to change your plan of action.
At the moment, there are only two Fear & Greed providers namely:
At the moment, there are only two Fear & Greed Indexes that are announced and calculated publicly. But the frequency of trading of these indexes is calculated daily. They are not updated in real-time frequency which is a huge limitation in terms of tracking the market behavior within a day. For intraday traders or short-term investors who are not interested in holding a portfolio longer than a day, these two Fear & Greed Indexes do not provide timely information for them to make trading decisions.
By understanding the limitations of these 2 Fear & Greed Indexes, BeQ Holdings decides to create a range of Fear & Greed Indexes that are not only updated in real-time but also expand to different types of financial products. If CNN Fear & Greed Index and Binance Fear & Greed Indexes focus on 2 main products: S&P 500 and CRYPTO, BeQ’s Fear & Greed Indexes are up to more than 35 Indexes and diversifies in many fields:
At the moment, more than 35 Fear & Greed Indexes are displayed and updated real-time on the company’s website.
On the company’s website, Fear & Greed Indexes are categorized into 6 main types: Global, USA, Europe, Asia, Vietnam, Others.
The picture attached below are Fear & Greed Indexes belonging to Global, namely MSCI Fear & Greed Index, GOLD Fear & Greed Index, BITCOIN Fear & Greed Index and so on. By accessing the company’s website, you can find more Fear & Greed Indexes belonging to Global criteria, not only those three ones.
BeQ Holdings’s Fear & Greed Indexes are not only calculated in real-time but also in many different intervals: 1 month, 3 months, 6 months and 1 year.
For example, like Fear & Greed VN 30 Index, BeQ Holdings provides users in different time frequencies: 1 month, 3 months, 6 months, 1 year.
BeQ Holdings do not only provide numbers but also visualize charts. The chart below is the chart of Fear & Greed VN 30 Index and its underlying value (VN 30 Index).